Yes, I know it’s a hard life but somebody has to do it……
Meet the team
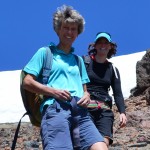

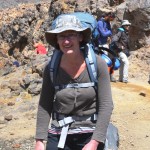
Left to right, Dr. Gillian Turner and PhD student Annika Greve from Victoria University, Wellington, New Zealand. Dr. Andreas Nilsson post doc and Emma Hodgson PhD student from University of Liverpool.
My PhD project ‘Further advances in determination of past geomagnetic field strength using synthetic samples, single crystals and basalt samples from the SW Pacific’ is part of a larger targeted palaeomagnetic study of the SW Pacific with Dr. Andreas Nilsson, post doc and supervisors Dr Mimi Hill and Dr. Andy Biggin all at the University of Liverpool. We are lucky enough to be working with Dr. Gillian Turner and her PhD student Annika Greve at Victoria University, Wellington, New Zealand who are also gathering Southern hemisphere palaeomagnetic data. They are looking to complete a palaeosecular variation curve (changes in the direction of the local geomagnetic field) for the last 10,000 years in the SW Pacific area this can then be used as a reference curve to help dating in the area. At Liverpool we look at the past intensity of the magnetic field, the methods used and modelling of the data. These projects are filling gaps in Southern hemisphere palaeomagnetic data which will in turn increase the resolution of the models and our understanding of magnetic field behaviour. A big thank you to Gillian and Annika for what must have been an awful lot of time and effort in planning.
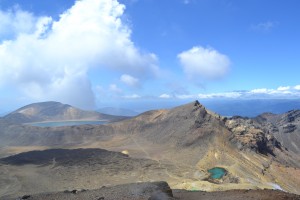
On top of Red Crater looking down into Central Crater, the darker area on the left is the 1955 flow we sampled
In February this year we headed off to the Tongariro National Park, central North Island to collect rock cores from lava flows on the flanks of Mount Ruapehu and Tongariro. We stayed at Whakapapa village on the slopes of Mount Ruapehu, a campsite for visitors who come for the spectacular walks and skiing this area is famous for. It was an ideal location for access to Ruapehu, Tongariro and the imposing Ngauruhoe (Mount Doom to any Lord of the Rings fans).
Our biggest issues in collecting samples were identifying suitable dated lavas and accessibility.
Finding lava was not a problem but finding flows that had been dated was! The younger Holocene lavas (less than ~11,500 years old) we were collecting are notoriously difficult to date with the commonly used potassium-argon (K/Ar) radiometric dating method. So far it has only been possible to date these lava flows through bracketing by tephra (ash) layers from past eruptions with known ages. Fortunately a group of geochemists from Victoria University, Wellington, NZ were using a new method of K/Ar dating to date Holocene flows as part of a mapping project in the area. They identified flows they had already dated using this method and some they were in the process of dating.
We were aware there would be accessibility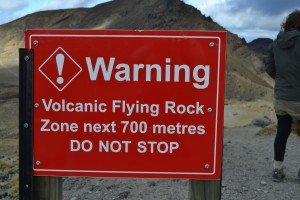 problems and a degree of hiking or ‘tramping’ as it’s known in New Zealand would be called for we weren’t disappointed! Most locations were remote and required a 2-3 hour tramp to reach the flow we wanted. Despite the effort of carrying pack, drill and sometimes large quantities of water (to cool the drill bit) the further we walked the more spectacular the views became. A five hour climb up onto the Tongariro plateau then over Red Crater into Central Crater with equipment and 20 litres of water between three of us certainly was one to remember. Accessibility was also hampered by the ongoing threat of eruption in the area the most recent from neighbouring Te Maari vents in Nov 2012.
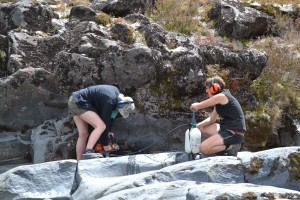 The area was dominated by dense andesites andsome basalt which proved to be quite taxing for the rock drills which were custom made from chainsaws with diamond tip drill bit attachments. The cores were 2.5cm diameter and around 10cm long these can then be shortened to fit the various instruments used for their analyses. Orientating the cores in respect to north was done with a sun compass as most of these rocks were strongly magnetised and deflected the needle on a magnetic compass.
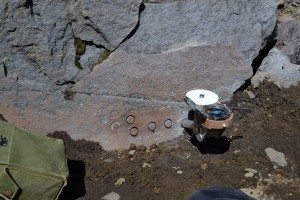
As we were in a National Park we had to be very conscious of our impact on the natural environment so efforts were made to conceal the holes made by the drill. A before and after picture of a drill site shows effort was made to reduce any impact.
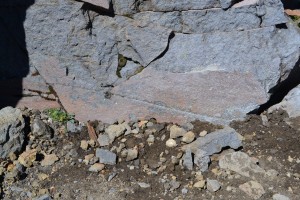
All in all we had a very successful trip to New Zealand so now it’s back to the laboratory for the next few months where we will be carrying out rock magnetic investigations to ascertain the best methods to measure the palaeointensities. The results of the of this project and associated collaborations will lead to a more comprehensive understanding of the magnetic field behaviour over the last 10ka in the SW Pacific.

Gillian, Andreas, Annika and Emma having a bit of fun!
Project Links
Targeted Palaeomagnetic Study of the SW Pacific
http://pcwww.liv.ac.uk/~nilsson/index.html
Welcome to our project website aimed at presenting and visualizing new palaeomagnetic research from 0-5Ma rocks and pottery from in and around the SW Pacific .
We are a research group based in the Geomagnetism laboratory, University of Liverpool with collaborators in New Zealand and Australia. The project will incorporate improved geomagnetic field models with data collected from the SW Pacific. At present most of the data comes from the Northern hemisphere and Hawaii, leaving a data deficit in the Southern hemisphere. Fieldwork in New Zealand will took place in February 2012, while other samples will be donated by collaborators.
In particular palaeointensity will be used in geomagnetic field models to better understand the deep Earth processes that create the magnetic field.
Unlocking the Secrets of the Geodynamo – the South West Pacific Key
http://www.victoria.ac.nz/scps/research/research-groups/enviro-phys-geo/geomagnetism/projects

